Why Integrate Graphics and Images in LibreOffice?
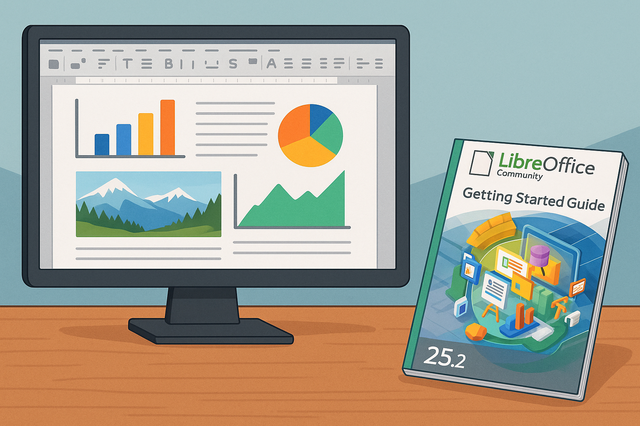
Integrating charts and images in LibreOffice documents adds an essential visual dimension that can enhance the understanding and appeal of your content. Whether you are using LibreOffice Writer to draft a report, LibreOffice Calc to present statistical data, or LibreOffice Impress for a presentation, the addition of visual aids can transform your documents into powerful communication tools.
Images help illustrate ideas, show examples, and make long documents easier to read. Charts make numerical information clearer by turning data into a visual format. In LibreOffice, these elements can be inserted, resized, positioned, and customized directly in your document, spreadsheet, or presentation.